
Loading
One column per round. Top shows the winner, the two rows below show each team's buy (by total loadout: eco under 5,000, half under 18,000, full above). Pick a round to see details.
 meeUta8

 KaChmTwitch
 Tototo

 yuzumaru1010meeUta8 +1TototomeeUta8 +1fuku
 もじゅ +1

 Cyb3rXmiu
 kuragemiuもじゅ80008000650150100800080090050850200800080008000
| Pistol | Eco | Half buy | Full buy | |
|---|---|---|---|---|
| My team | 1 / 2 | - | 4 / 6 | 8 / 15 |
| Enemy team | 1 / 2 | - | 4 / 6 | 5 / 15 |
Total loadout value of each team, per round.
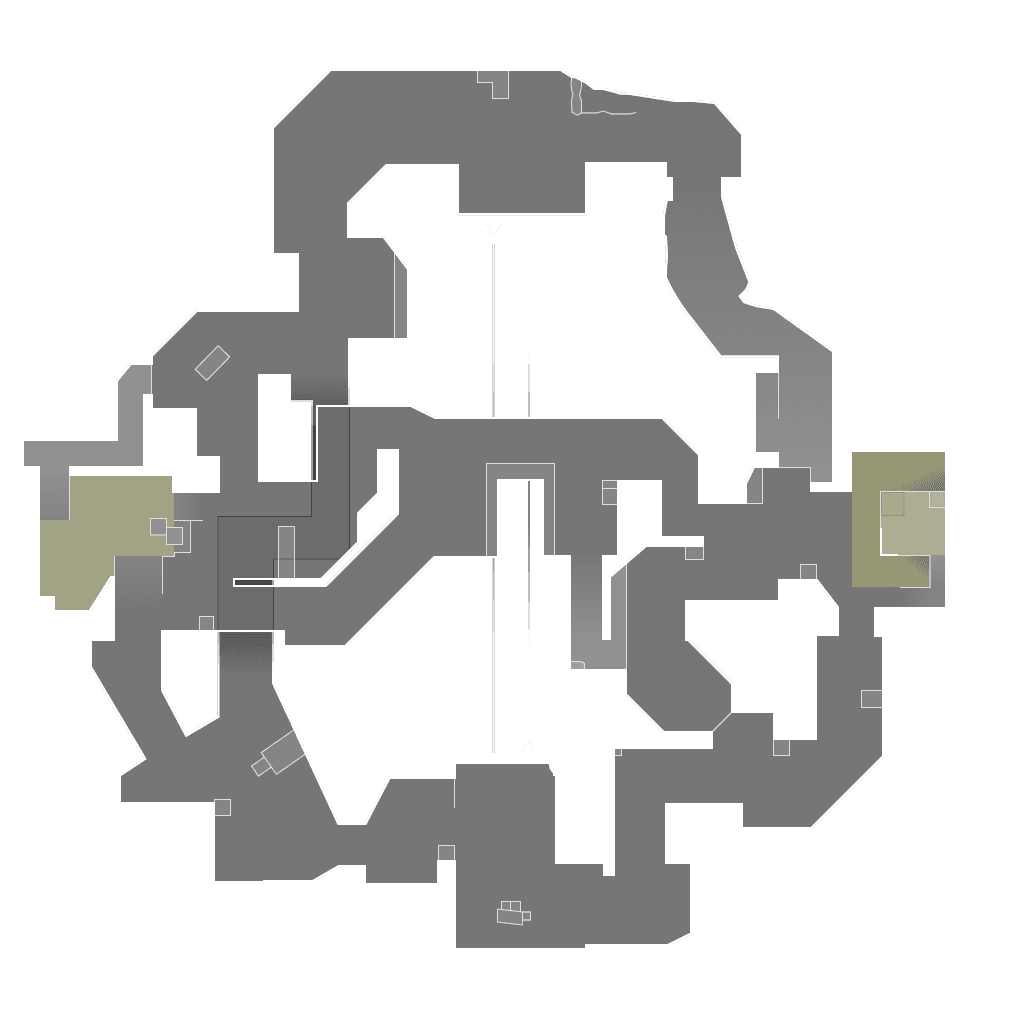
Dots mark where players fell. Lines run from the shooter.
| Player | ACS | K / D / A | +/- | ADR | HS | KAST | FK / FD | 3K+ |
|---|---|---|---|---|---|---|---|---|
| meeUta8#2255Jett | 570 | 43 / 15 / 5 | +28 | 334 | 12.8% | 82.6% | 13 / 7 | 8 |
| miu#7988Sova | 192 | 18 / 11 / 5 | +7 | 140 | 17% | 78.3% | 1 / 0 | 2 |
| yuzumaru1010#7596Raze | 151 | 12 / 13 / 3 | -1 | 98 | 3.4% | 73.9% | 0 / 1 | 0 |
 ハチミー#2131Sage | 129 | 10 / 17 / 3 | -7 | 83 | 7.4% | 73.9% | 0 / 1 | 1 |
| Cyb3rX#7937Brimstone | 21 | 0 / 16 / 4 | -16 | 19 | 9.1% | 43.5% | 0 / 0 | 0 |
| Player | ACS | K / D / A | +/- | ADR | HS | KAST | FK / FD | 3K+ |
|---|---|---|---|---|---|---|---|---|
| fuku#9699Jett | 257 | 20 / 17 / 6 | +3 | 167 | 19% | 69.6% | 3 / 3 | 0 |
| もじゅ#9335Sova | 173 | 13 / 17 / 9 | -4 | 111 | 10.8% | 56.5% | 1 / 4 | 1 |
| kurage#2851Iso | 170 | 15 / 15 / 6 | 0 | 110 | 22.2% | 56.5% | 2 / 1 | 1 |
| Tototo#5755Omen | 153 | 13 / 16 / 5 | -3 | 99 | 6.1% | 65.2% | 2 / 2 | 0 |
| KaChmTwitch#aikiPhoenix | 140 | 11 / 18 / 3 | -7 | 94 | 8% | 47.8% | 1 / 4 | 0 |
ACS average combat score, ADR average damage per round, HS headshot rate, KAST share of rounds with a kill, assist, survival or trade, FK / FD first kills and first deaths, 3K+ rounds with three or more kills.