

Loading
One column per round. Top shows the winner, the two rows below show each team's buy (by total loadout: eco under 5,000, half under 18,000, full above). Pick a round to see details.
 KaikaiAbilityミケラの刃
 Luxe +1

 Conor McGregor
 Farmer +1Kaikai
 장규진KYU
 冬と春Farmer
 odin merchant
 NiuuuFarmerNiuuu +1장규진KYUNiuuuZeRo900100
 9005070010060005003008000800150750507001006000
| Pistol | Eco | Half buy | Full buy | |
|---|---|---|---|---|
| My team | 2 / 2 | - | 3 / 5 | 8 / 11 |
| Enemy team | 0 / 2 | 0 / 2 | 1 / 5 | 4 / 9 |
Total loadout value of each team, per round.
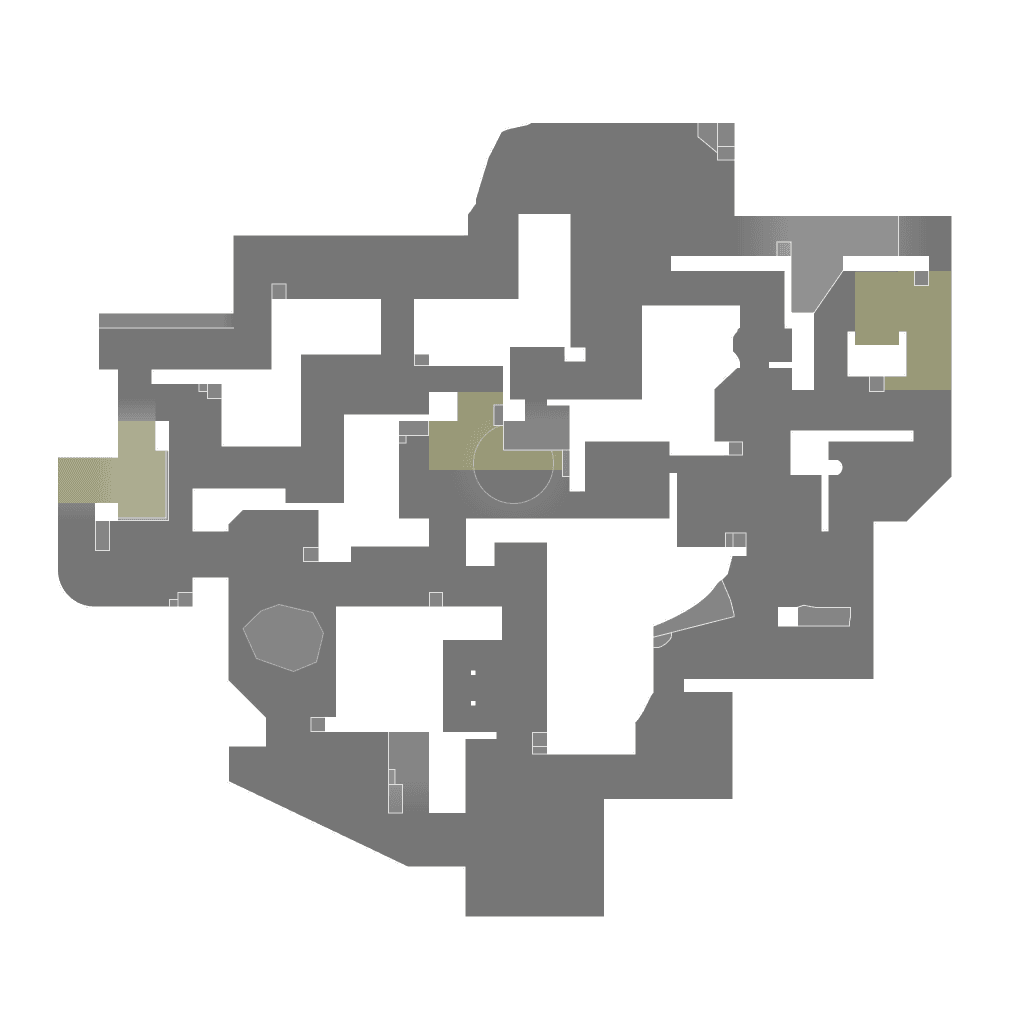
Dots mark where players fell. Lines run from the shooter.
| Player | ACS | K / D / A | +/- | ADR | HS | KAST | FK / FD | 3K+ |
|---|---|---|---|---|---|---|---|---|
Kaikai#0829Chamber | 310 | 19 / 13 / 5 | +6 | 204 | 39% | 83.3% | 5 / 2 | 2 |
Niuuu#0312Jett | 270 | 20 / 9 / 2 | +11 | 160 | 33.3% | 77.8% | 0 / 1 | 2 |
| Luxe#tamaReyna | 244 | 16 / 10 / 7 | +6 | 139 | 17.3% | 77.8% | 3 / 1 | 2 |
| odin merchant#7777Sova | 232 | 15 / 9 / 7 | +6 | 144 | 17.8% | 88.9% | 2 / 1 | 1 |
冬と春#0124Clove | 173 | 10 / 15 / 10 | -5 | 119 | 34.4% | 88.9% | 1 / 2 | 0 |
| Player | ACS | K / D / A | +/- | ADR | HS | KAST | FK / FD | 3K+ |
|---|---|---|---|---|---|---|---|---|
| ZeRo#0326Clove | 273 | 15 / 19 / 8 | -4 | 163 | 29.3% | 72.2% | 1 / 3 | 3 |
| Farmer#7465Fade | 236 | 16 / 14 / 6 | +2 | 140 | 36.1% | 66.7% | 1 / 0 | 0 |
| Conor McGregor#더블챔프Neon | 163 | 7 / 18 / 6 | -11 | 112 | 20.3% | 61.1% | 2 / 1 | 0 |
| ミケラの刃#eldenChamber | 162 | 11 / 14 / 0 | -3 | 106 | 21.1% | 61.1% | 2 / 3 | 1 |
| 장규진KYU#nswerWaylay | 130 | 7 / 15 / 7 | -8 | 95 | 39.3% | 55.6% | 1 / 4 | 0 |
ACS average combat score, ADR average damage per round, HS headshot rate, KAST share of rounds with a kill, assist, survival or trade, FK / FD first kills and first deaths, 3K+ rounds with three or more kills.