

Loading
One column per round. Top shows the winner, the two rows below show each team's buy (by total loadout: eco under 5,000, half under 18,000, full above). Pick a round to see details.
 08 아디다스남

 시대를초월하는뒤틀린에임의티라노
 애옹이1xtap
 Misfit97
 애옹이
 하은이를위한레디언트계정왕귀1
 Luv
 하은이를위한레디언트계정
 어라이게아닌데 +1LuvT1 DH어라이게아닌데T1 DHMisfit9708 아디다스남 +1T1 DH900508000750507001006000900100800080008001508000
| Pistol | Eco | Half buy | Full buy | |
|---|---|---|---|---|
| My team | 1 / 2 | 0 / 1 | 4 / 6 | 7 / 17 |
| Enemy team | 1 / 2 | 0 / 1 | 1 / 2 | 12 / 21 |
Total loadout value of each team, per round.
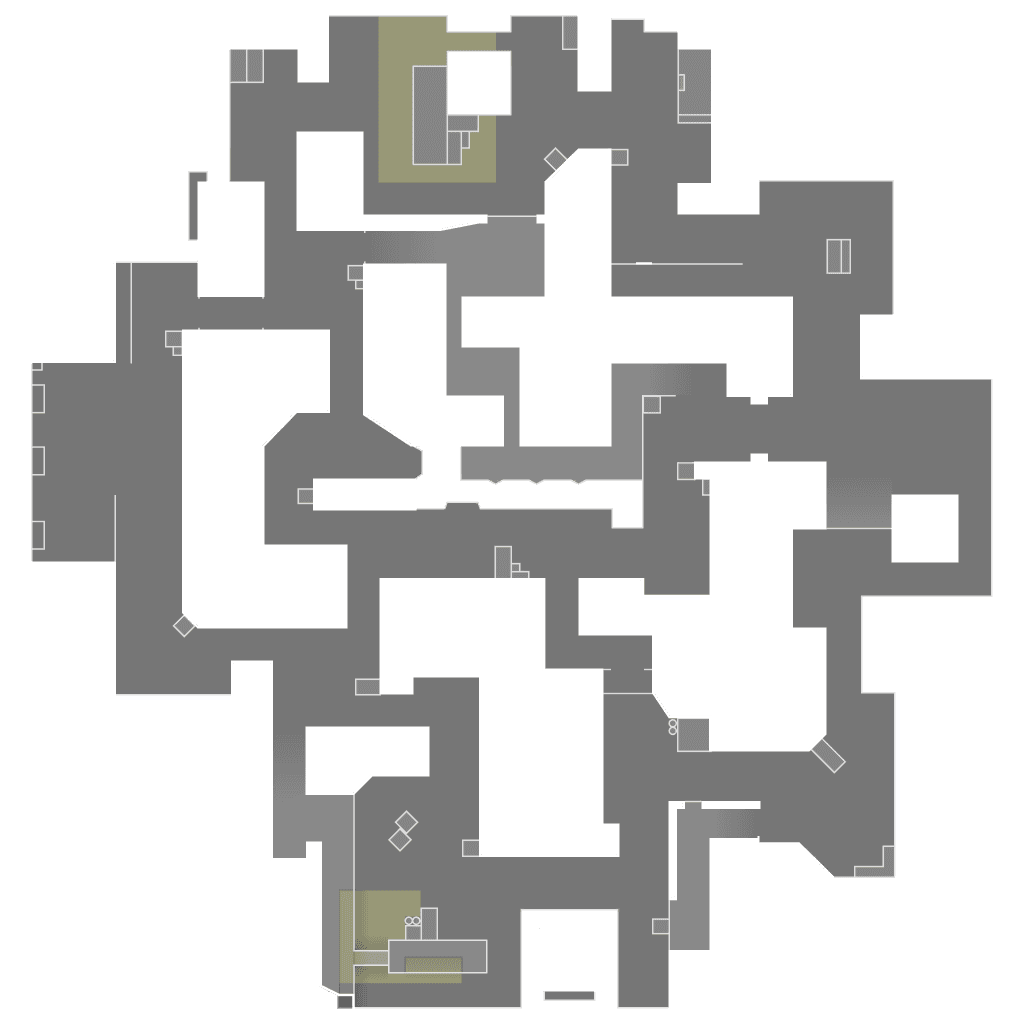
Dots mark where players fell. Lines run from the shooter.
| Player | ACS | K / D / A | +/- | ADR | HS | KAST | FK / FD | 3K+ |
|---|---|---|---|---|---|---|---|---|
| T1 DH#1002Sova | 338 | 32 / 16 / 7 | +16 | 234 | 30.2% | 76.9% | 1 / 1 | 5 |
왕귀1#0207Jett | 241 | 23 / 20 / 5 | +3 | 151 | 43.8% | 80.8% | 4 / 2 | 2 |
Luv#0101Clove | 165 | 11 / 23 / 14 | -12 | 114 | 17.5% | 73.1% | 0 / 4 | 0 |
시대를초월하는뒤틀린에임의티라노#사우르스Chamber | 159 | 14 / 20 / 5 | -6 | 110 | 21.1% | 50% | 2 / 6 | 0 |
| 애옹이#애옹애옹앵Hush | 140 | 11 / 22 / 8 | -11 | 91 | 25% | 61.5% | 0 / 6 | 1 |
| Player | ACS | K / D / A | +/- | ADR | HS | KAST | FK / FD | 3K+ |
|---|---|---|---|---|---|---|---|---|
| Misfit97#ERLAXJett | 279 | 25 / 19 / 8 | +6 | 174 | 25.6% | 69.2% | 7 / 3 | 2 |
| 08 아디다스남#가오보이Reyna | 239 | 23 / 18 / 3 | +5 | 152 | 33.3% | 76.9% | 7 / 0 | 2 |
| 1xtap#1tapChamber | 210 | 21 / 18 / 4 | +3 | 130 | 13.7% | 73.1% | 3 / 1 | 2 |
어라이게아닌데#이럴수가Omen | 199 | 17 / 17 / 16 | 0 | 138 | 16.4% | 76.9% | 1 / 2 | 1 |
| 하은이를위한레디언트계정#레디언트Sova | 164 | 14 / 19 / 8 | -5 | 105 | 31.6% | 80.8% | 1 / 1 | 1 |
ACS average combat score, ADR average damage per round, HS headshot rate, KAST share of rounds with a kill, assist, survival or trade, FK / FD first kills and first deaths, 3K+ rounds with three or more kills.