

Loading
One column per round. Top shows the winner, the two rows below show each team's buy (by total loadout: eco under 5,000, half under 18,000, full above). Pick a round to see details.
 Klaxon

 Good Raccoon
 ok bro
 Klaxon
 家族がすべてです

 Genesis
 tanjirortp
 TQsushi
 Danthephesstanjirortp家族がすべてです
 HeroKillerStain家族がすべてですok bro8000800070010060000800950100900508000750506000
| Pistol | Eco | Half buy | Full buy | |
|---|---|---|---|---|
| My team | 2 / 2 | 0 / 1 | 0 / 7 | 2 / 7 |
| Enemy team | 0 / 2 | 2 / 2 | - | 11 / 13 |
Total loadout value of each team, per round.
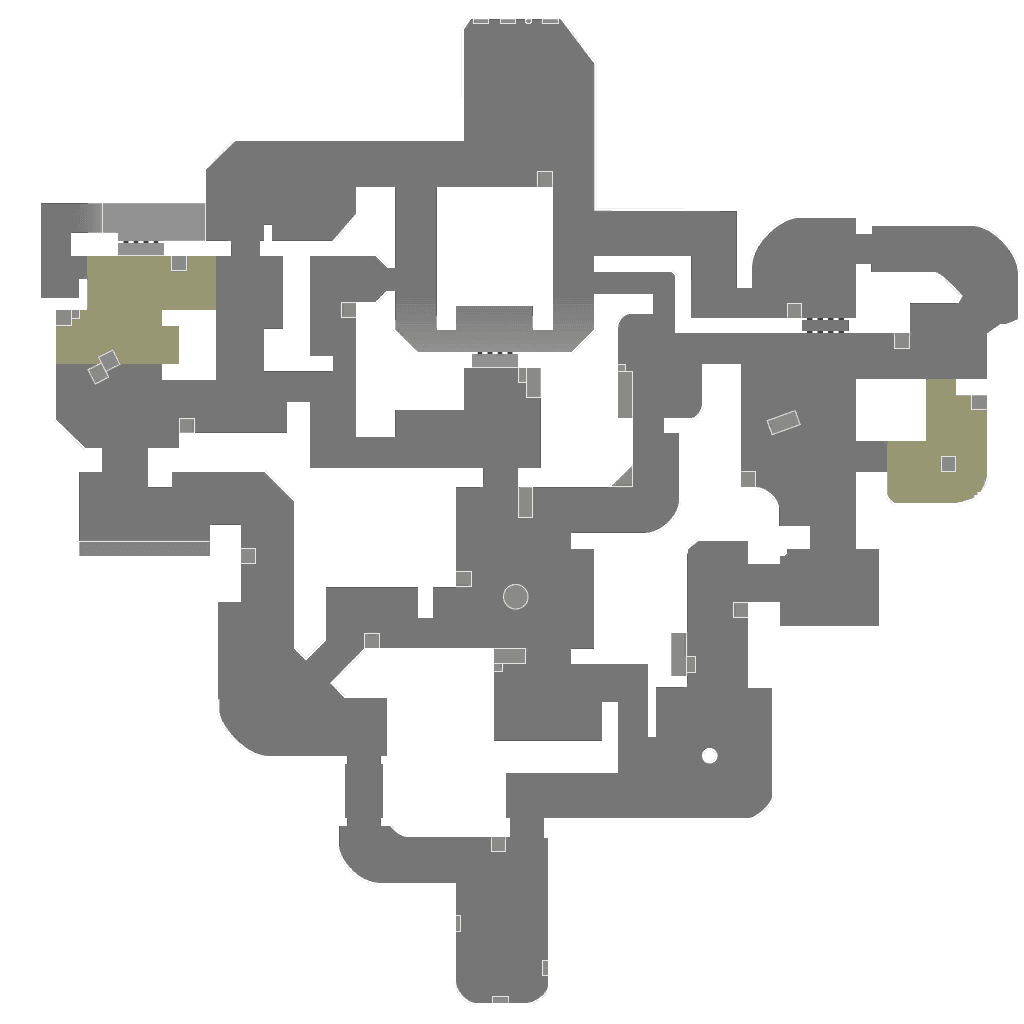
Dots mark where players fell. Lines run from the shooter.
| Player | ACS | K / D / A | +/- | ADR | HS | KAST | FK / FD | 3K+ |
|---|---|---|---|---|---|---|---|---|
Danthephess#123Killjoy | 204 | 12 / 13 / 3 | -1 | 140 | 51.9% | 76.5% | 2 / 2 | 0 |
家族がすべてです#3034Sage | 197 | 11 / 14 / 7 | -3 | 133 | 26.3% | 64.7% | 2 / 2 | 1 |
| Klaxon#patouDeadlock | 161 | 10 / 17 / 2 | -7 | 100 | 29.2% | 58.8% | 2 / 1 | 1 |
| TQsushi#EUWChamber | 134 | 8 / 14 / 3 | -6 | 92 | 27.3% | 58.8% | 2 / 1 | 0 |
 FreeJulian#1899Cypher | 98 | 5 / 13 / 2 | -8 | 81 | 13.8% | 47.1% | 0 / 3 | 0 |
| Player | ACS | K / D / A | +/- | ADR | HS | KAST | FK / FD | 3K+ |
|---|---|---|---|---|---|---|---|---|
| Genesis#4508Chamber | 533 | 34 / 7 / 0 | +27 | 319 | 42.5% | 82.4% | 5 / 1 | 6 |
| tanjirortp#хорошPhoenix | 221 | 14 / 11 / 2 | +3 | 152 | 40% | 70.6% | 1 / 0 | 2 |
| Good Raccoon#2312Breach | 164 | 9 / 11 / 8 | -2 | 115 | 26.7% | 70.6% | 0 / 2 | 0 |
HeroKillerStain#BLOODJett | 126 | 7 / 9 / 3 | -2 | 93 | 13.8% | 70.6% | 2 / 4 | 0 |
| ok bro#onlyClove | 104 | 7 / 8 / 6 | -1 | 60 | 21.1% | 88.2% | 1 / 1 | 0 |
ACS average combat score, ADR average damage per round, HS headshot rate, KAST share of rounds with a kill, assist, survival or trade, FK / FD first kills and first deaths, 3K+ rounds with three or more kills.