
Loading
One column per round. Top shows the winner, the two rows below show each team's buy (by total loadout: eco under 5,000, half under 18,000, full above). Pick a round to see details.
 NiuuuAbility
 廖威凱
 缠绕我脸上悲伤应该如何卸妆
 Niuuu
 OBF draco chenn +1缠绕我脸上悲伤应该如何卸妆OBF draco chenn +1
 寄語句OBF draco chenn +1
 Autof1re
 Dength
 lonely sniperOBF draco chenn +1Dength
 950508000
 80007001005504001,000090050800070010055050
| Pistol | Eco | Half buy | Full buy | |
|---|---|---|---|---|
| My team | 2 / 2 | - | 3 / 3 | 8 / 11 |
| Enemy team | 0 / 2 | 0 / 2 | 1 / 5 | 2 / 7 |
Total loadout value of each team, per round.
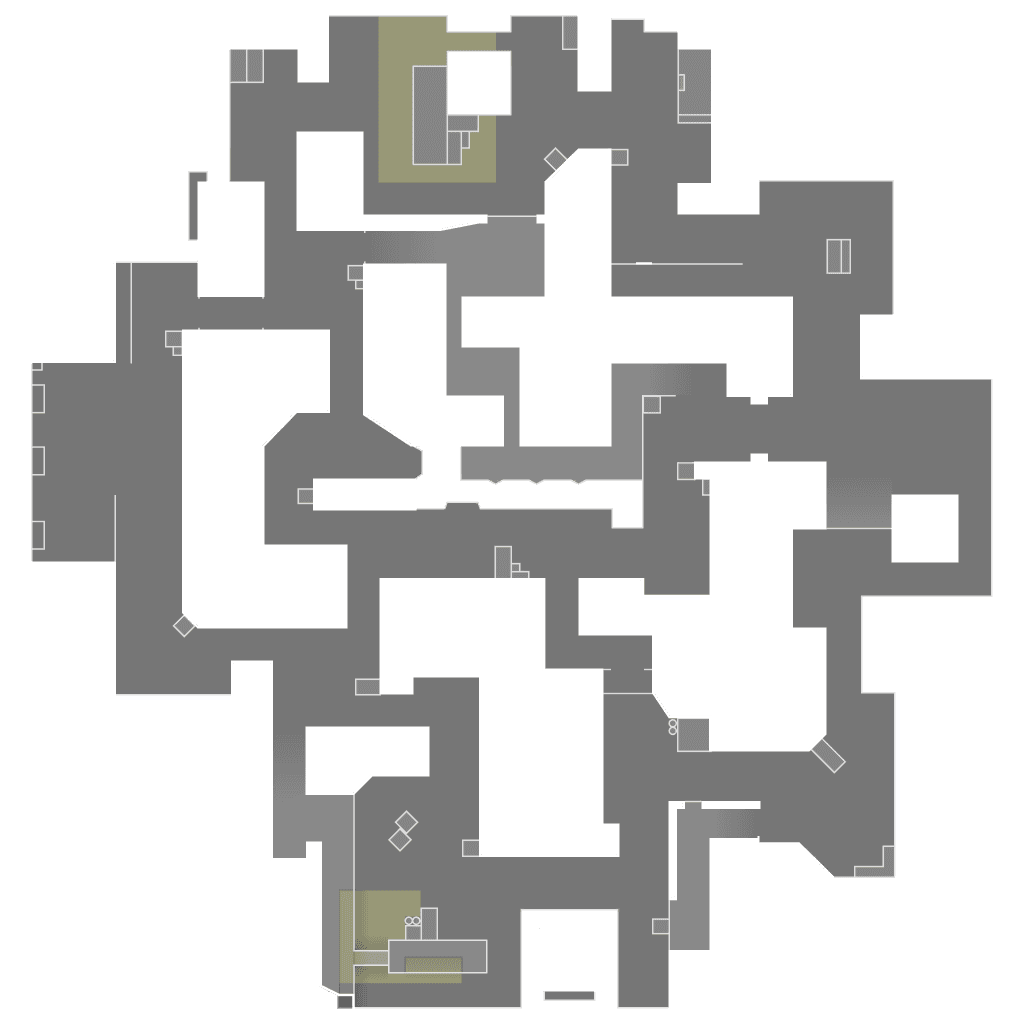
Dots mark where players fell. Lines run from the shooter.
| Player | ACS | K / D / A | +/- | ADR | HS | KAST | FK / FD | 3K+ |
|---|---|---|---|---|---|---|---|---|
donk666#1911Reyna | 373 | 22 / 9 / 10 | +13 | 266 | 41.7% | 87.5% | 4 / 0 | 2 |
Niuuu#0312Chamber | 296 | 17 / 8 / 2 | +9 | 186 | 40% | 93.8% | 3 / 0 | 3 |
OBF draco chenn#909Omen | 294 | 18 / 5 / 15 | +13 | 183 | 31.1% | 100% | 1 / 0 | 2 |
| lonely sniper#4261Sova | 193 | 10 / 11 / 11 | -1 | 128 | 15% | 93.8% | 0 / 0 | 0 |
| WtIiqaw#UAUJett | 175 | 10 / 11 / 5 | -1 | 122 | 9.5% | 62.5% | 1 / 7 | 1 |
| Player | ACS | K / D / A | +/- | ADR | HS | KAST | FK / FD | 3K+ |
|---|---|---|---|---|---|---|---|---|
| 寄語句#2386Clove | 257 | 14 / 16 / 0 | -2 | 167 | 26.3% | 56.3% | 2 / 1 | 1 |
| Autof1re#0011Vyse | 205 | 10 / 14 / 5 | -4 | 124 | 43.5% | 56.3% | 1 / 0 | 0 |
| Dength#6669Reyna | 157 | 7 / 16 / 3 | -9 | 105 | 33.3% | 50% | 1 / 1 | 0 |
廖威凱#666Jett | 141 | 7 / 16 / 3 | -9 | 82 | 23.8% | 56.3% | 2 / 5 | 0 |
| 缠绕我脸上悲伤应该如何卸妆#gkkrrSova | 120 | 6 / 15 / 2 | -9 | 85 | 31.6% | 43.8% | 1 / 2 | 0 |
ACS average combat score, ADR average damage per round, HS headshot rate, KAST share of rounds with a kill, assist, survival or trade, FK / FD first kills and first deaths, 3K+ rounds with three or more kills.