

Loading
One column per round. Top shows the winner, the two rows below show each team's buy (by total loadout: eco under 5,000, half under 18,000, full above). Pick a round to see details.
 TuQu3Deix4

 NwR Upset
 igot
 cobyxt
 BielzinGameprayAbility
 BielzinherPaysandu1914 +1AbilityBielzinGamepray
 Traveira +1Paysandu1914TuQu3Deix4 +1TraveiraTuQu3Deix4
 Sampaio ma fase900508000
 8000
 80007001009505090050
 80007001006000
| Pistol | Eco | Half buy | Full buy | |
|---|---|---|---|---|
| My team | 1 / 2 | 0 / 1 | 3 / 8 | 2 / 8 |
| Enemy team | 1 / 2 | 0 / 1 | 3 / 4 | 9 / 12 |
Total loadout value of each team, per round.
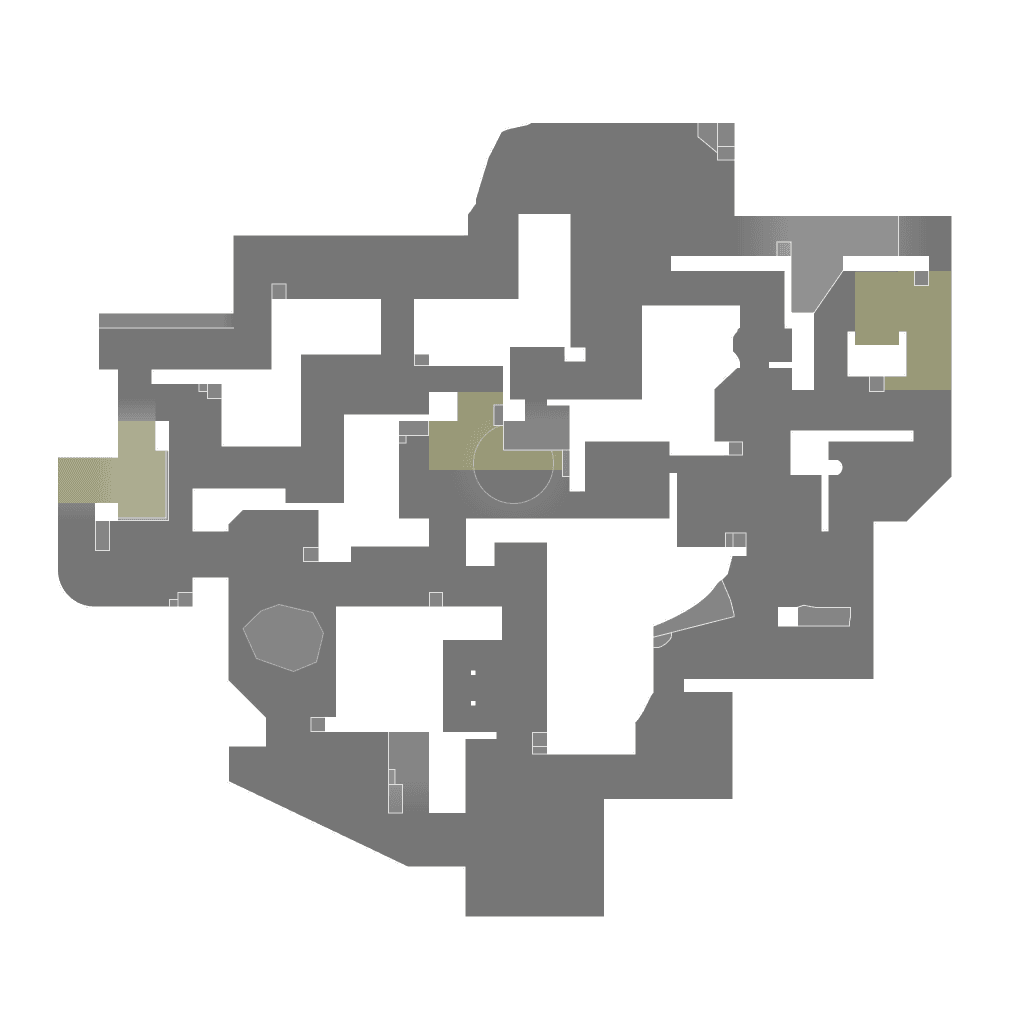
Dots mark where players fell. Lines run from the shooter.
| Player | ACS | K / D / A | +/- | ADR | HS | KAST | FK / FD | 3K+ |
|---|---|---|---|---|---|---|---|---|
BielzinGamepray#br1Chamber | 356 | 22 / 14 / 5 | +8 | 239 | 25% | 84.2% | 7 / 1 | 2 |
Sampaio ma fase#SEPHush | 225 | 16 / 16 / 3 | 0 | 134 | 25.6% | 52.6% | 3 / 2 | 1 |
| Traveira#TheoSage | 219 | 14 / 15 / 3 | -1 | 145 | 23.3% | 73.7% | 2 / 1 | 1 |
NwR Upset#NWRROmen | 120 | 8 / 16 / 6 | -8 | 75 | 31.6% | 68.4% | 1 / 2 | 0 |
| cobyxt#cobyxNeon | 37 | 2 / 6 / 1 | -4 | 25 | 20% | 73.7% | 0 / 0 | 0 |
| Player | ACS | K / D / A | +/- | ADR | HS | KAST | FK / FD | 3K+ |
|---|---|---|---|---|---|---|---|---|
TuQu3Deix4#BR1Reyna | 337 | 24 / 9 / 8 | +15 | 220 | 20% | 78.9% | 2 / 1 | 3 |
igot#ownerFade | 294 | 21 / 10 / 5 | +11 | 194 | 39.2% | 89.5% | 0 / 0 | 2 |
| Paysandu1914#tiagoChamber | 126 | 8 / 16 / 4 | -8 | 83 | 8% | 47.4% | 4 / 3 | 0 |
| Bielzinher#7891Clove | 119 | 8 / 14 / 9 | -6 | 78 | 16.7% | 78.9% | 0 / 1 | 0 |
 Paysanduu#TpovoJett | 98 | 6 / 14 / 5 | -8 | 74 | 12.5% | 63.2% | 0 / 8 | 0 |
ACS average combat score, ADR average damage per round, HS headshot rate, KAST share of rounds with a kill, assist, survival or trade, FK / FD first kills and first deaths, 3K+ rounds with three or more kills.