

Loading
11/12/2026, 06:34 / 33 min
One column per round. Top shows the winner, the two rows below show each team's buy (by total loadout: eco under 5,000, half under 18,000, full above). Pick a round to see details.
 yamyam

 golden future
 Escherichia coli +1
 носочки джетт
 мусульманго +1
 HaskiMelinoldoмусульмангоMelinoldoKiller Queen
 GREENGREEN +2Melinoldoyamyam +1
 SIFON2000
 1,0000900508000700100600090050900100800075050700100
| Pistol | Eco | Half buy | Full buy | |
|---|---|---|---|---|
| Team A | 2 / 2 | - | 3 / 5 | 8 / 15 |
| Team B | 0 / 2 | - | 4 / 9 | 5 / 11 |
Total loadout value of each team, per round.
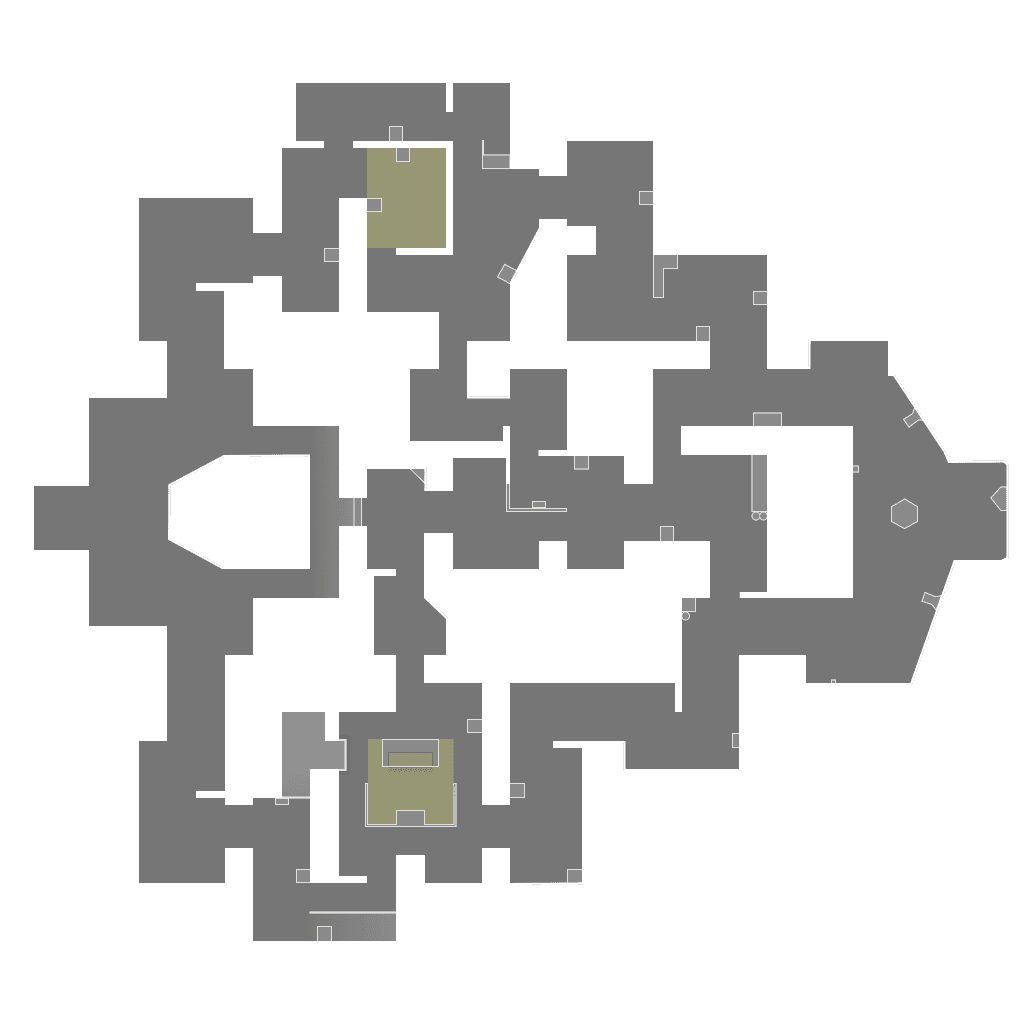
Dots mark where players fell. Lines run from the shooter.
| Player | ACS | K / D / A | +/- | ADR | HS | KAST | FK / FD | 3K+ |
|---|---|---|---|---|---|---|---|---|
yamyam#sumnClove | 333 | 27 / 17 / 4 | +10 | 213 | 39.7% | 77.3% | 4 / 2 | 3 |
Killer Queen#8240Reyna | 299 | 23 / 14 / 6 | +9 | 200 | 38.5% | 81.8% | 5 / 1 | 2 |
Escherichia coli#BIOJett | 222 | 15 / 18 / 9 | -3 | 160 | 30.4% | 77.3% | 3 / 2 | 2 |
мусульманго#жиесSova | 191 | 17 / 15 / 3 | +2 | 126 | 20% | 63.6% | 0 / 0 | 1 |
| GREENGREEN#YAOIChamber | 159 | 11 / 16 / 6 | -5 | 103 | 32% | 86.4% | 3 / 2 | 0 |
| Player | ACS | K / D / A | +/- | ADR | HS | KAST | FK / FD | 3K+ |
|---|---|---|---|---|---|---|---|---|
| Melinoldo#12123Clove | 413 | 29 / 24 / 11 | +5 | 272 | 35.4% | 81.8% | 3 / 3 | 4 |
| носочки джетт#durikJett | 200 | 16 / 17 / 1 | -1 | 144 | 64% | 72.7% | 3 / 3 | 1 |
| SIFON2000#6969Sage | 184 | 14 / 17 / 8 | -3 | 127 | 28.6% | 63.6% | 1 / 2 | 0 |
| golden future#000Reyna | 141 | 11 / 18 / 3 | -7 | 99 | 25.7% | 63.6% | 0 / 5 | 0 |
| Haski#4505Fade | 139 | 10 / 17 / 8 | -7 | 102 | 18.9% | 77.3% | 0 / 2 | 0 |
ACS average combat score, ADR average damage per round, HS headshot rate, KAST share of rounds with a kill, assist, survival or trade, FK / FD first kills and first deaths, 3K+ rounds with three or more kills.