

Loading
11/15/2026, 06:38 / 10 min
One column per round. Top shows the winner, the two rows below show each team's buy (by total loadout: eco under 5,000, half under 18,000, full above). Pick a round to see details.
 청은난잔광 +1

 Dotte
 요루처음청은난잔광
 UPUPAbility요루처음
 MC 쉴드 +1
 검단13대장MC 쉴드
 태양열sun로봇맨
 Matteo8000
 80008000700070010080008000700100700100500300
| Pistol | Eco | Half buy | Full buy | |
|---|---|---|---|---|
| Team A | 2 / 2 | - | 1 / 2 | 2 / 3 |
| Team B | 0 / 2 | - | 1 / 2 | 1 / 3 |
Total loadout value of each team, per round.
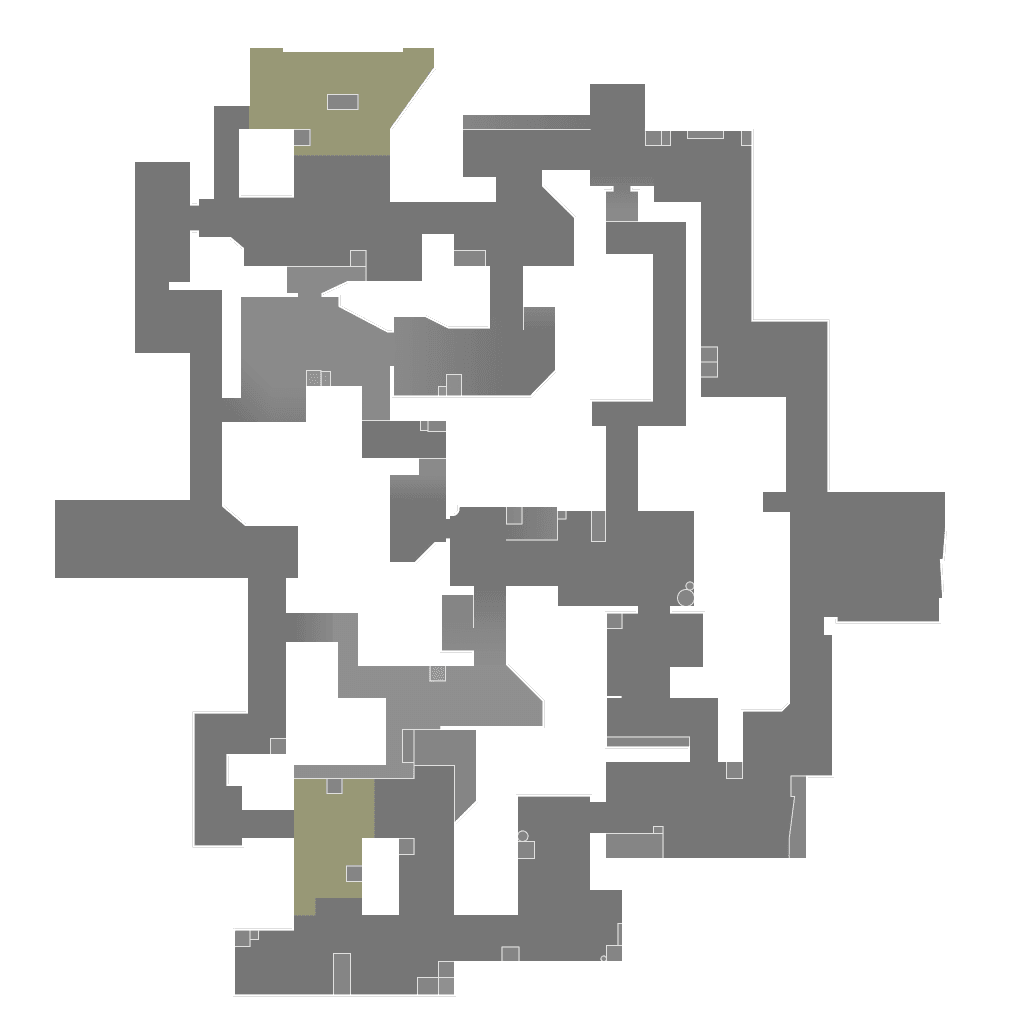
Dots mark where players fell. Lines run from the shooter.
| Player | ACS | K / D / A | +/- | ADR | HS | KAST | FK / FD | 3K+ |
|---|---|---|---|---|---|---|---|---|
| Dotte#LatteJett | 395 | 10 / 5 / 1 | +5 | 243 | 23.1% | 42.9% | 1 / 3 | 3 |
| 요루처음#1111Neon | 120 | 3 / 6 / 0 | -3 | 65 | 8.3% | 42.9% | 0 / 1 | 0 |
| 태양열sun#태양열Sova | 100 | 2 / 7 / 1 | -5 | 69 | 18.2% | 28.6% | 0 / 2 | 0 |
| Matteo#3371Sage | 27 | 0 / 6 / 0 | -6 | 27 | 0% | 14.3% | 0 / 0 | 0 |
| 검단13대장#1111Chamber | 5 | 0 / 6 / 0 | -6 | 5 | 0% | 14.3% | 0 / 0 | 0 |
ACS average combat score, ADR average damage per round, HS headshot rate, KAST share of rounds with a kill, assist, survival or trade, FK / FD first kills and first deaths, 3K+ rounds with three or more kills.