

Loading
11/19/2026, 03:12 / 28 min
One column per round. Top shows the winner, the two rows below show each team's buy (by total loadout: eco under 5,000, half under 18,000, full above). Pick a round to see details.
 지율간지 +1

 김성현
 김탁기 +2

 몬스터나인
 CHAS +1

 뭐 임마NS sh1nramyun BK지율간지NS sh1nramyun BKCHAS
 김건기NS sh1nramyun BK
 김종군 +1
 일진우성90050900509001007505050030075020075050650150550250500100
| Pistol | Eco | Half buy | Full buy | |
|---|---|---|---|---|
| Team A | 2 / 2 | - | 1 / 3 | 10 / 13 |
| Team B | 0 / 2 | 0 / 1 | 2 / 6 | 3 / 9 |
Total loadout value of each team, per round.
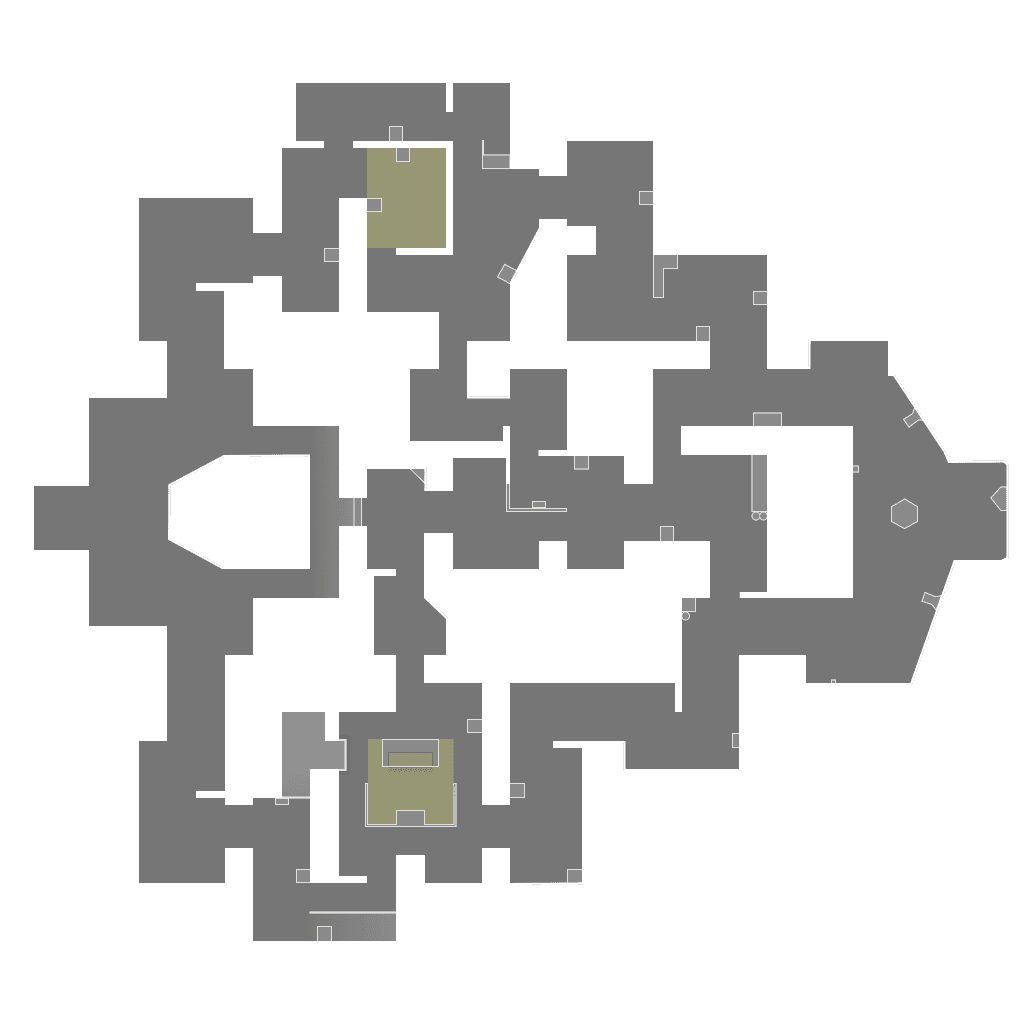
Dots mark where players fell. Lines run from the shooter.
| Player | ACS | K / D / A | +/- | ADR | HS | KAST | FK / FD | 3K+ |
|---|---|---|---|---|---|---|---|---|
NS sh1nramyun BK#2011Jett | 216 | 14 / 15 / 2 | -1 | 152 | 31% | 50% | 1 / 2 | 1 |
뭐 임마#확 그냥Veto | 194 | 12 / 16 / 2 | -4 | 141 | 28.9% | 66.7% | 0 / 0 | 0 |
일진우성#8330Omen | 167 | 9 / 15 / 9 | -6 | 112 | 15.6% | 55.6% | 0 / 2 | 0 |
| 김성현#111Hush | 161 | 10 / 18 / 2 | -8 | 102 | 21% | 66.7% | 5 / 2 | 0 |
| 몬스터나인#0422KAY/O | 156 | 9 / 17 / 6 | -8 | 87 | 4.8% | 61.1% | 3 / 3 | 1 |
ACS average combat score, ADR average damage per round, HS headshot rate, KAST share of rounds with a kill, assist, survival or trade, FK / FD first kills and first deaths, 3K+ rounds with three or more kills.